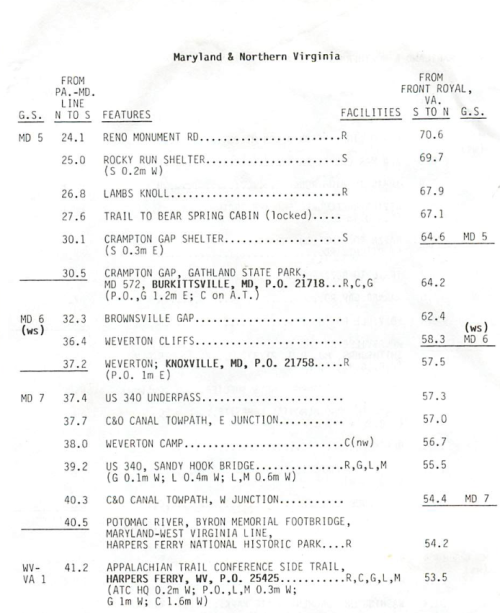
Long distance hikers, especially old-school hikers before hiking apps, have been accustomed to rely upon “databooks“, a brief text summary of the important intersections, water sources, features, and distances of a long hike. Here is a portion of a page from the Appalachian Trail 1987 databook, a slim pocket-size saddle-stapled booklet.
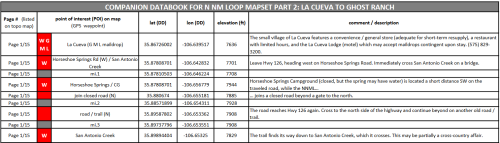
And this is an image from a portion of the databook for the Northern New Mexico Loop (by Blisterfree, the creator of the Grand Enchantment Trail).
Not all backpackers use a databook during their hike, even pre-app, but it is still useful for planning prior to the trip. Some hikers do find an advantage in reading a text summary on trail, rather than squinting at a topo map representation on their smartphone screen. Hike your own hike; your mileage may vary; use tools and do not let them use you.
In our previous post, we were able to find a long loop route in the Gila National Forest (that does not repeat any segment), in the form of a numeric list of nodes. Our graph imported via OSMnx from OpenStreetMap includes extra information as node attributes and edge attributes, that we can extract in a Pythony way to make our own databook of sorts. Here is an example of the text information in one edge of our graph.
{'osmid': 243511168, 'ref': '165', 'name': 'Pine Flat Trail #165', 'highway': 'path', 'oneway': False, 'reversed': [False, True], 'length': 4374.8279999999995, 'from': [2509057410, 2509594627, 2509057291, 2509594252, 2509057424, 2509594385, 2509594643, 2509594263, 2509594657, 2509594529, 2509057314, 2509594279, 2509594664, 2509594284, 2509594543, 2509594673, 2509594294, 2509057334, 2509594680, 2509594556, 2509594176, 2509594306, 2509594691, 2509594435, 2509057350, 2509594568,
<truncated>
From that information we can generate a summary from our Euler graph.
  MILE   ELEVATION  TRAIL                         INTERSECTION
...
  105.0  6509       Hells Hole Trail #268         West Fork Trail #151
  105.5  6529       Trail #785                    Hells Hole Trail #268
  106.0  6483       West Fork Trail #151          Trail #785
  109.7  6834       Turkey Creek Trail #155       West Fork Trail #151
  111.8  7851       Mogollon Creek Trail #153     Turkey Creek Trail #155
...
The Python code is fairly short (excluding the altitude part, which is not included in our OSM data). The column format is enabled by the library columnar, exceedingly easy to use.
def report_path(Q, txt='',freedom_units=False,lat_long=False):
    meters_to_mile = 0.0006213712
    meters_to_feet = 3.28084
    meters_to_km = 0.001

    if nx.is_eulerian(Q):
        total_length = 0
        data = []
        for u,v,k in nx.eulerian_circuit(Q, keys=True):
             data_line = []
             if freedom_units:
                 data_line.append(str(round(total_length*meters_to_mile,1)))
             else:
                 data_line.append(str(round(total_length*meters_to_km,1)))

             d = Q.get_edge_data(u,v)[k]
             length=0
             if 'length' in d:
                 length = d['length'] #meters
                 total_length += length
             node_attr = Q.nodes(data=True)[u]
             long = node_attr['x']
             lat = node_attr['y']
             if lat_long:
                 data_line.append(lat)
                 data_line_append(long)
             elevation = get_elevation(lat,long) #in meters
             elevation *= meters_to_feet #freedom units
             if freedom_units:
                 data_line.append(str(round(elevation*meters_to_feet)))
             else:
                 data_line.append(str(round(elevation)))

             trail_name=''
             if 'name' in d:
                 trail_name = d['name']
                 if not isinstance(trail_name, str):
                     trail_name = ','.join(trail_name) #in case is a list
             data_line.append(trail_name)

             crossing = set()
             crossing_txt = ''
             for u,neightbor,k,d in Q.edges(u,data=True, keys=True):
                 if 'name' in d:
                     name = d['name']
                     if not isinstance(name, str): #FIX with a foreach
                         name = ','.join(name) #in case is a list
                     if name != trail_name:
                         crossing.add(name)
             if len(crossing)>0:
                 crossing_txt = ','.join(crossing)
             data_line.append(crossing_txt)

             data.append(data_line)
        header = []
        if freedom_units:
            header.append('MILE')
        else:
            header.append('KM')
        if lat_long:
            header.append('LAT')
            header.append('LONG')
        header.append('ELEVATION')
        header.append('TRAIL')
        header.append('INTERSECTION')
        table = columnar(data, header, no_borders=True)
        print(table)
    else:
        print('The graph is not eulerian')
One alternative, that only occurred to me after I had written this, is to output the route as CSV (comma separated values), import into a spreadsheet, and make any changes to presentation and format within the spreadsheet, and eventually export as PDF.
We still do not have water sources, towns, fence or road crossings, etc. I will go off and have a long think on how to include those features automagically.
Download source code here.